Why do we measure antennas?

When designing an antenna, it’s imperative to verify that it works for its intended application. We do this by measuring it’s radiated pattern characteristics and verify that not only does it have the proper shape but also is able to receive signals of interest and reject or limit all others. When antennas do not operate as intended, the results can range from annoying (dropped cell phone call, limited wi‐if access) to disastrous (undetected severe weather threats, erroneous air traffic control, unacquired enemy target).
The measurement concept
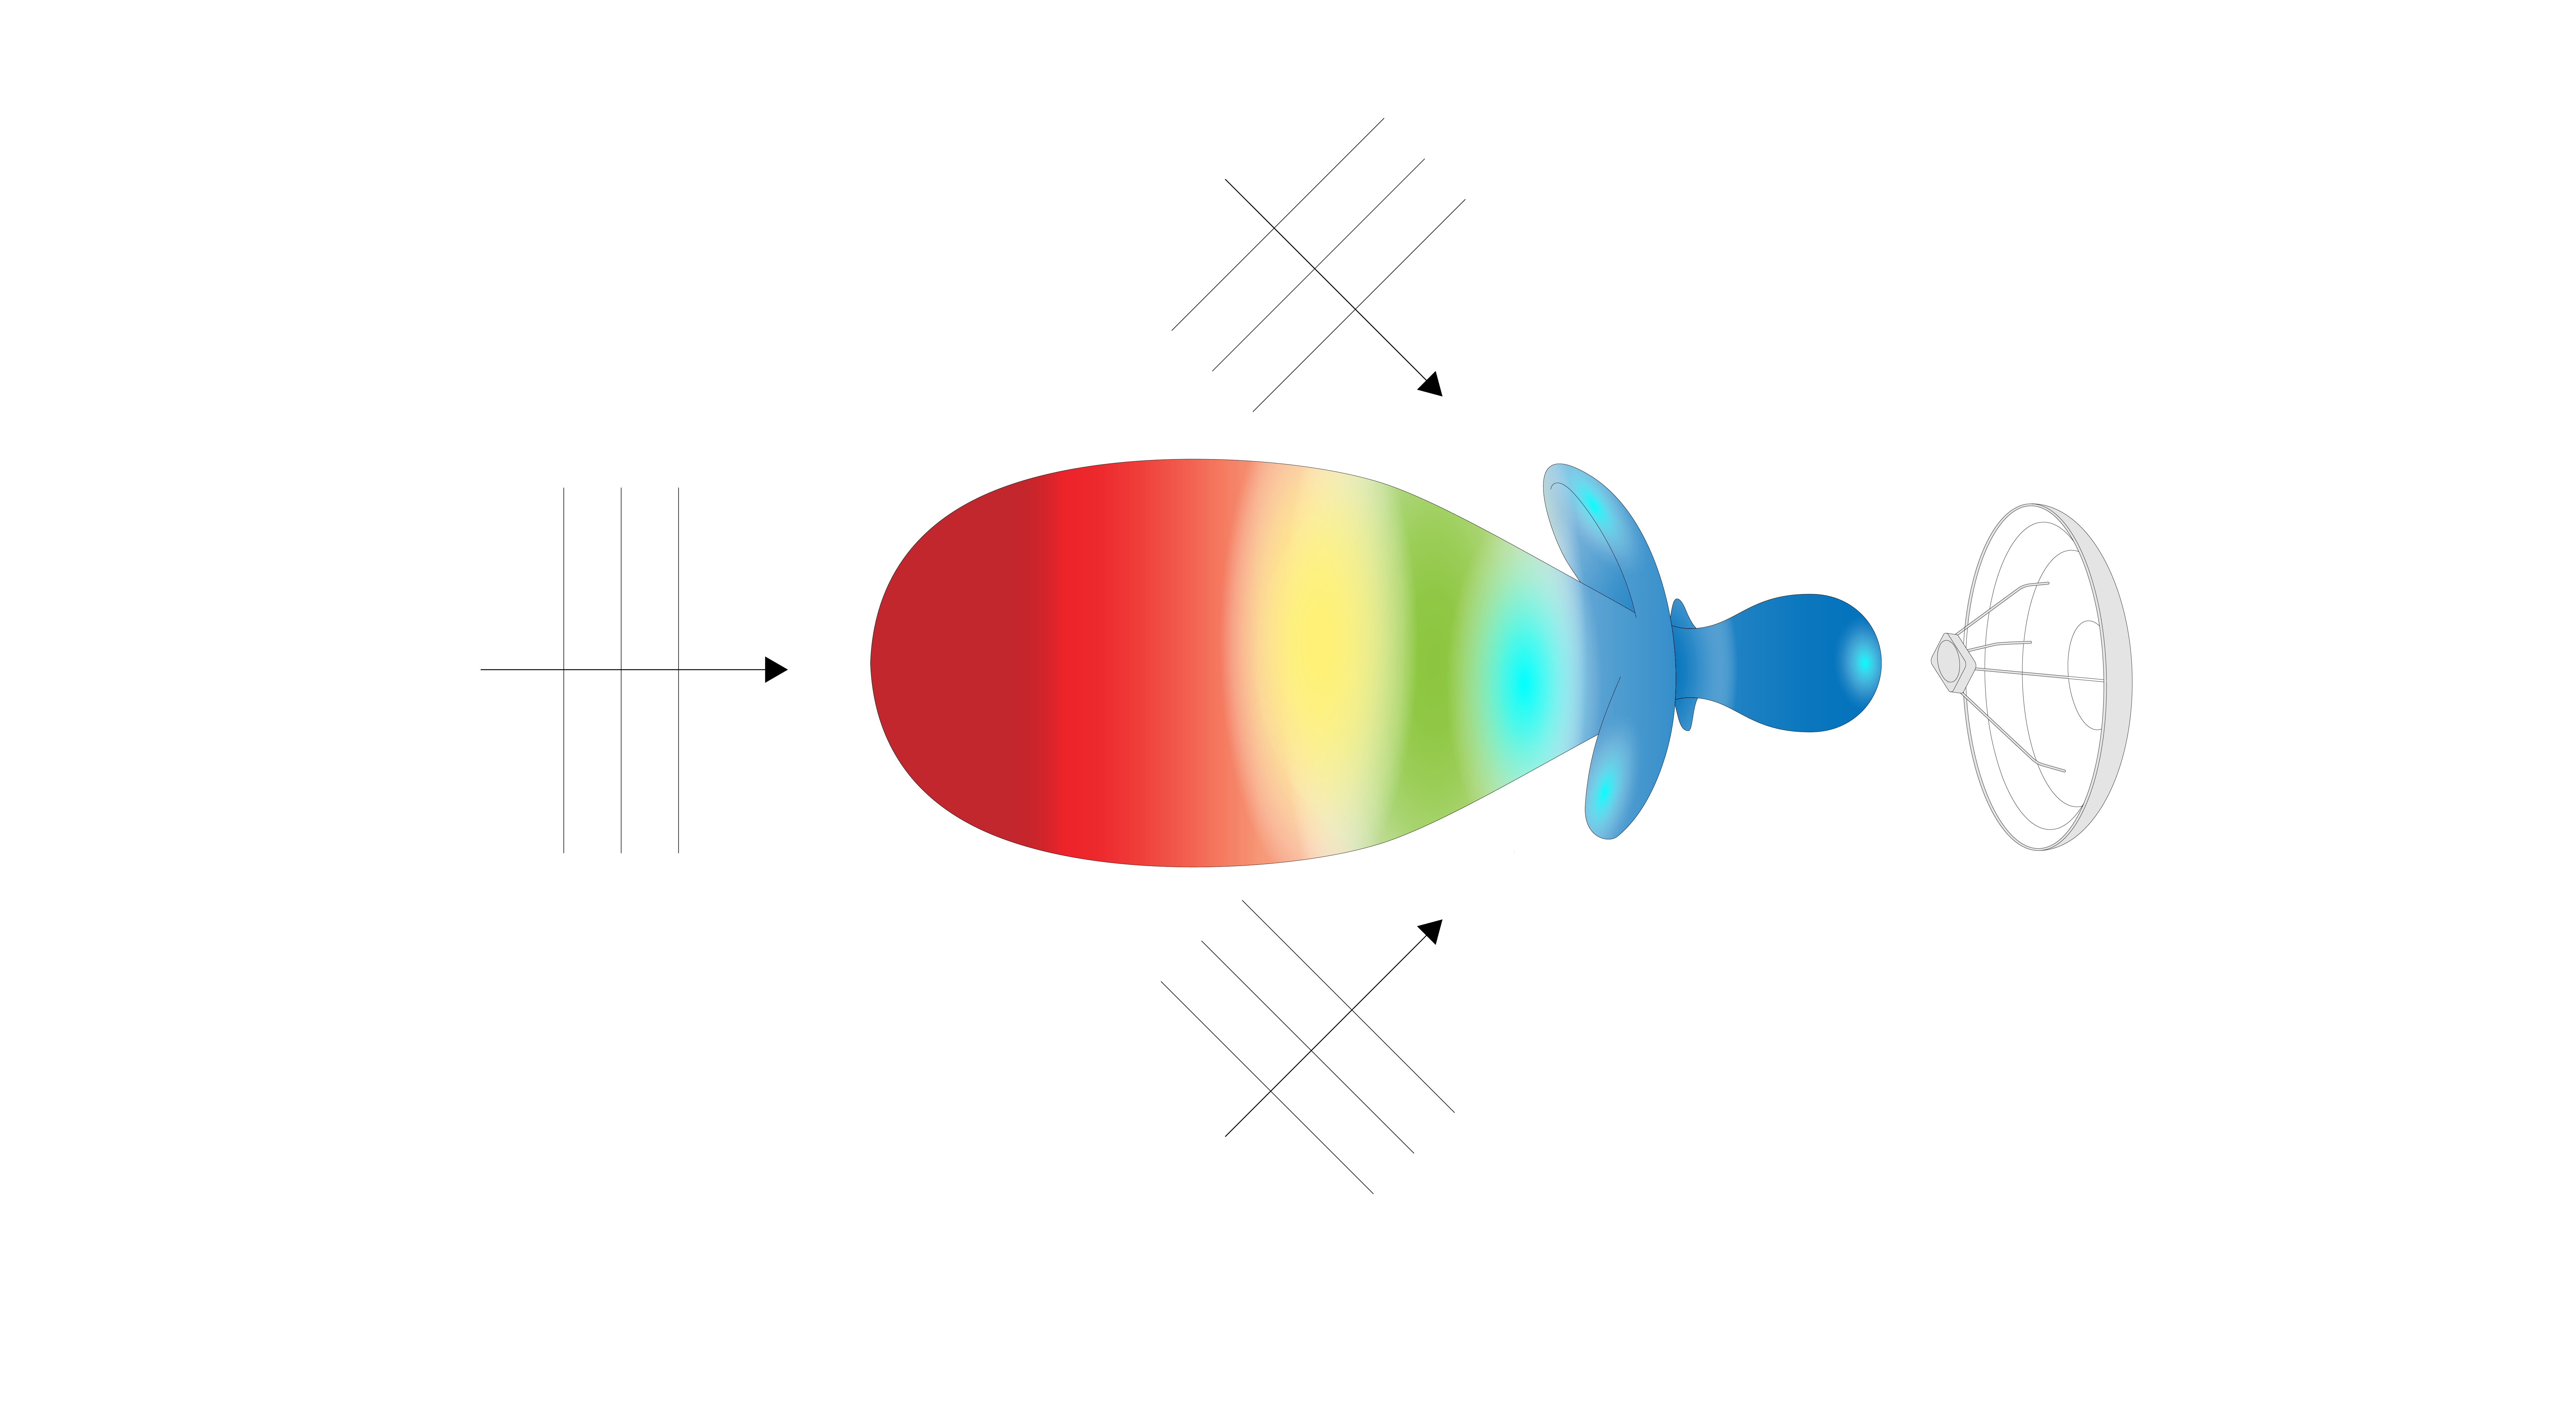
Antennas are designed to operate at large distances from one another, where the receiving electromagnetic waves represent a flat plane surface. This is known as the far field. Ideally, we would like to measure an antenna’s response to a plane wave in any direction. To truly do this, we would need to locate the source of the plane wave at a distance of infinity and from numerous different locations around the test antenna. We also want to measure just the response of our antenna and not other stray signals, therefore a known and/or controlled environment is required.
- We use antennas when they are a long way away, so we want to test the antennas when they are a long way apart.
- The purpose of antenna testing is to determine the AUT response (in most cases) to a perfect plane wave from a range of directions.
- Project an image of the source antenna at infinity.
- We want to measure an antenna in a known environment (i.e. quiet-zone). .
A simple pattern measurement example
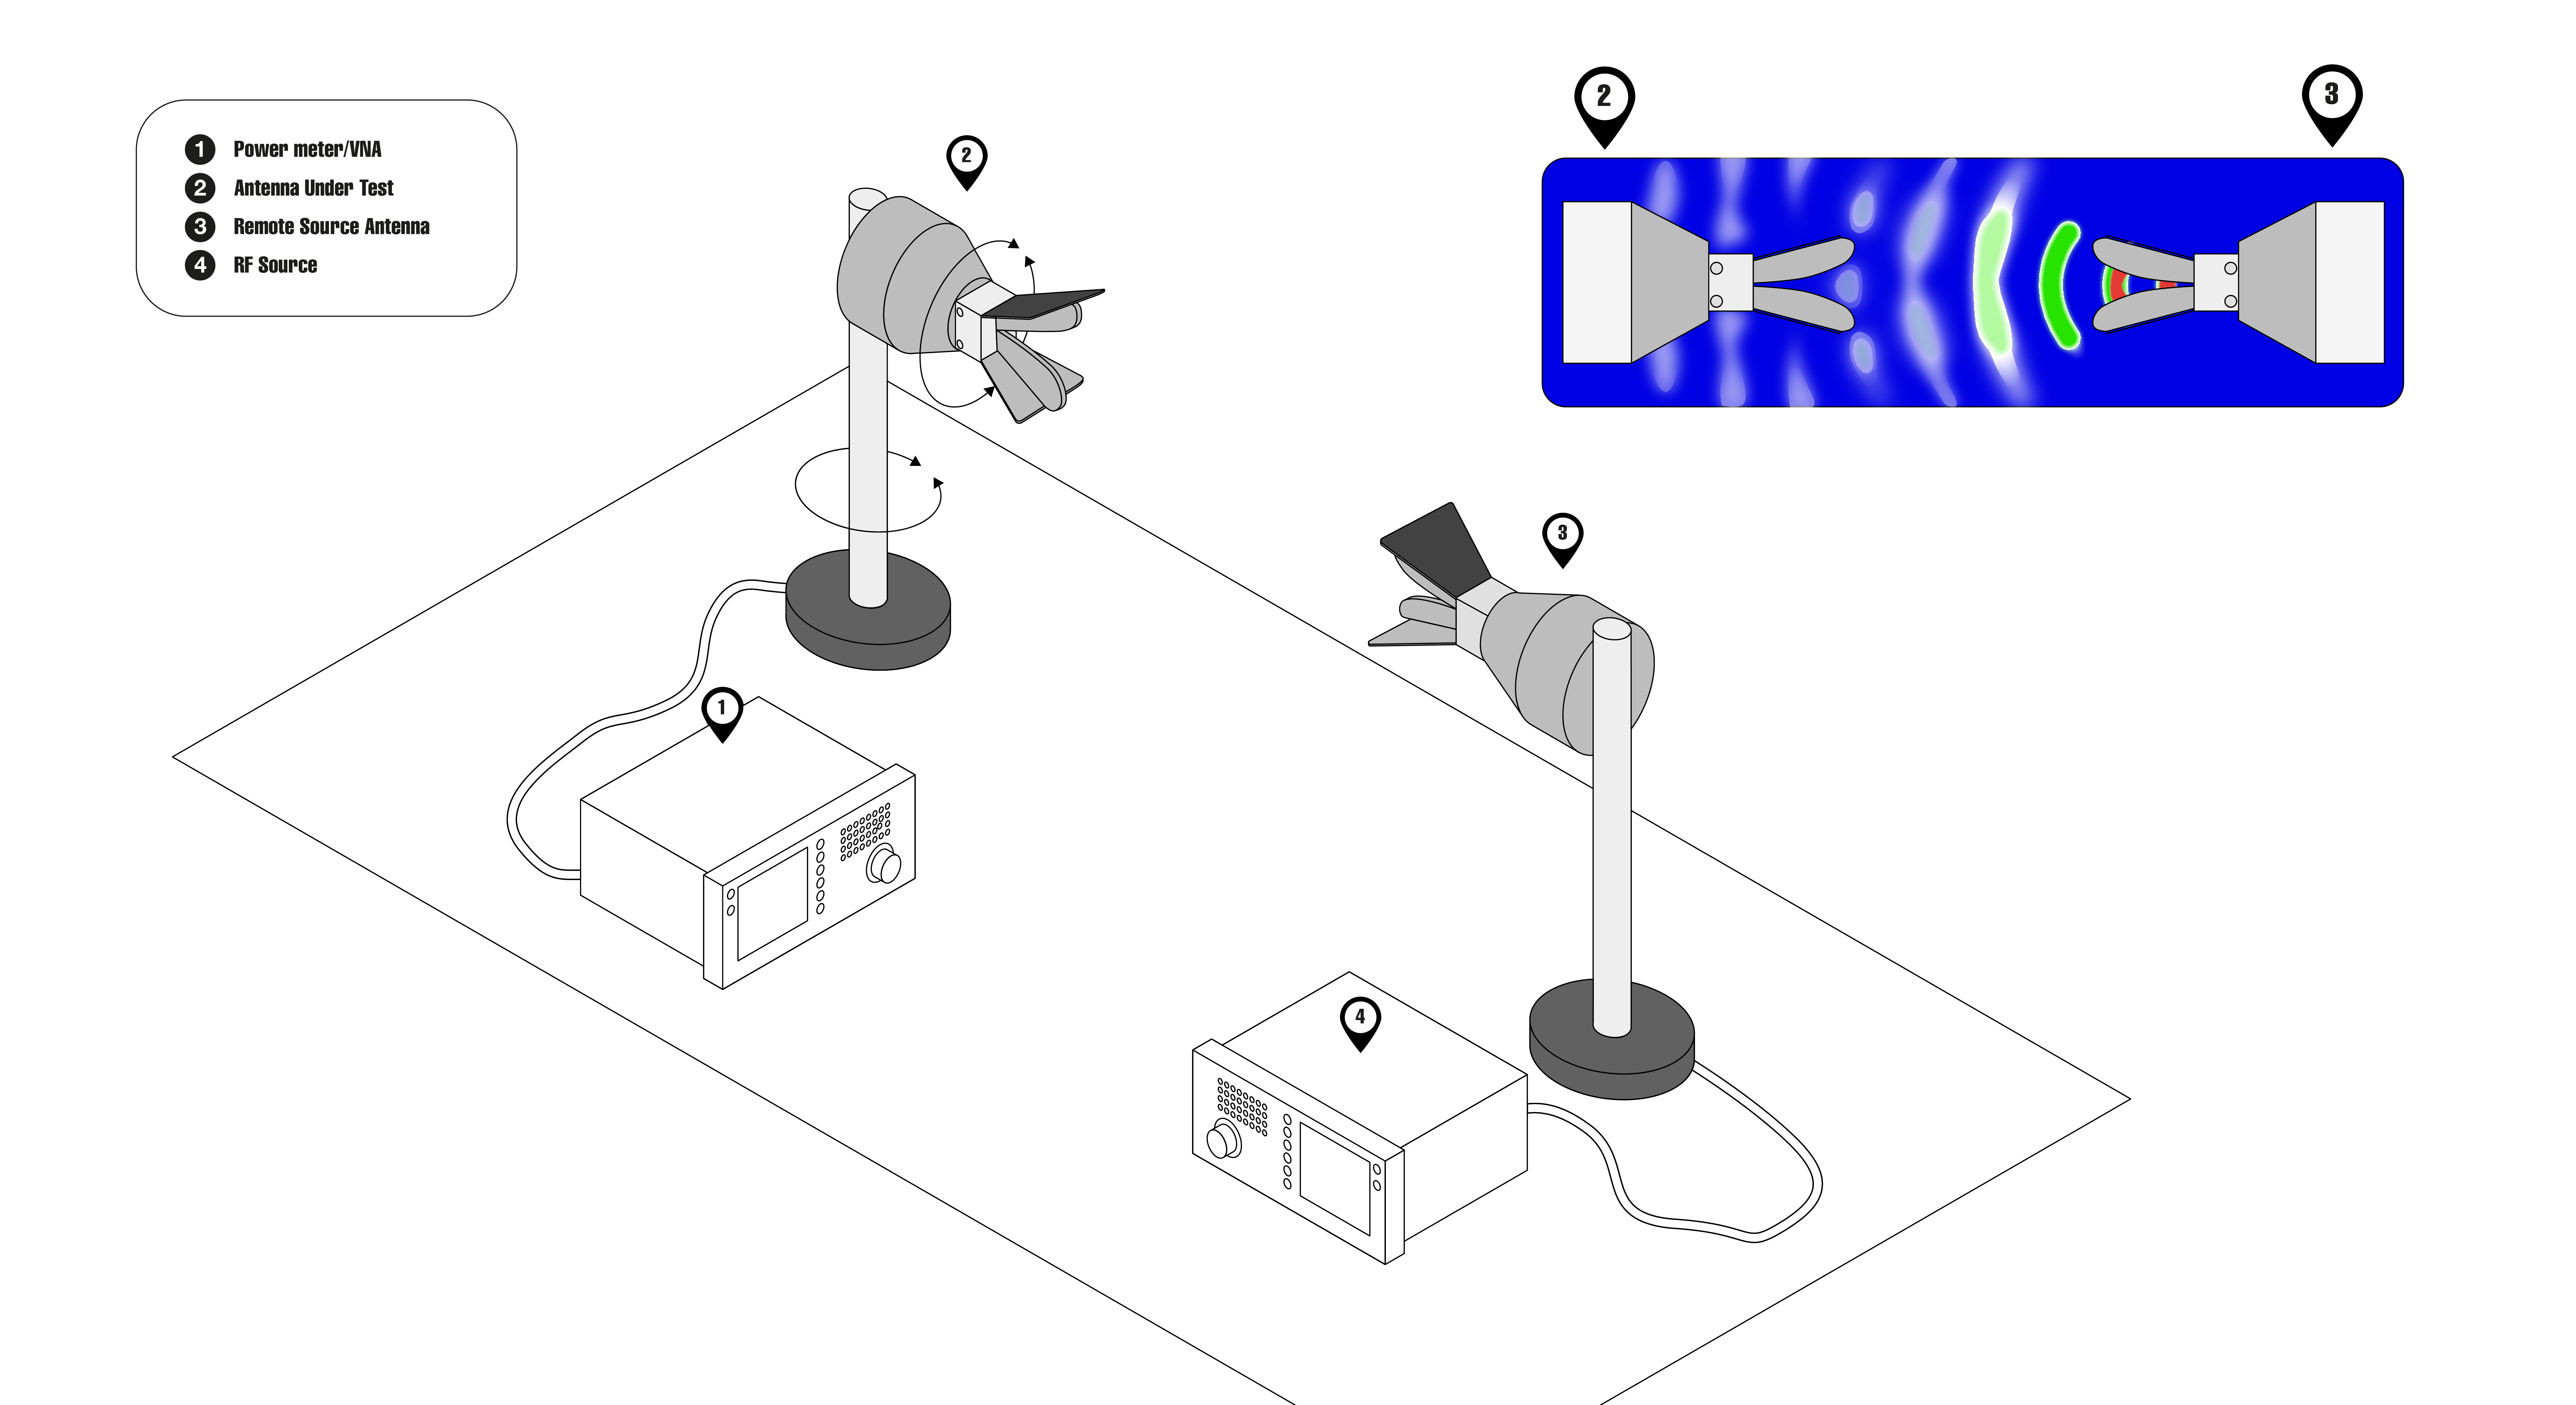
The AUT is rotated opposite a remote source antenna
- Measure the response (antennas coupling) as a function of observation angle, i.e. direction
- Produces measured radiation pattern data
Rather than move the source antenna around the antenna under test, a much more practical approach is to keep the source antenna fixed and move the test antenna so that it is illuminated by the incoming plane wave at different orientations. This can be accomplished through implementation of a mechanical antenna positioning system. In addition to the positioning system, we need a way of generating the RF signal at the source antenna and receiving it at the test antenna. A simple antenna measurement system is shown above where a RF source is used to generate the radiated signal from the remote source antenna and a power meter, Vector Network Analyzer (VNA), Spectrum Analyzer (SA) or some other RF measurement device is used to measure the received signal from the Antenna Under Test (AUT).
Although the concept of measuring an antenna's response from infinite locations is the optimal approach, it poses significant practical complexities. A more feasible solution involves keeping the source antenna stationary and adjusting the orientation of the test antenna to capture the incoming plane wave. This alternative method simplifies the setup by employing a mechanical antenna positioning system and utilizing commonly available RF equipment for signal generation and measurement.
A Far-field antenna measurement system
In addition to measuring the received signal, we need to correlate it to the angle of arrival at the AUT. A positioner controller is used to reposition the antenna. At each position, the receiver records the measured antenna signal. The resulting antenna pattern is a plot of these measured values versus angular position.
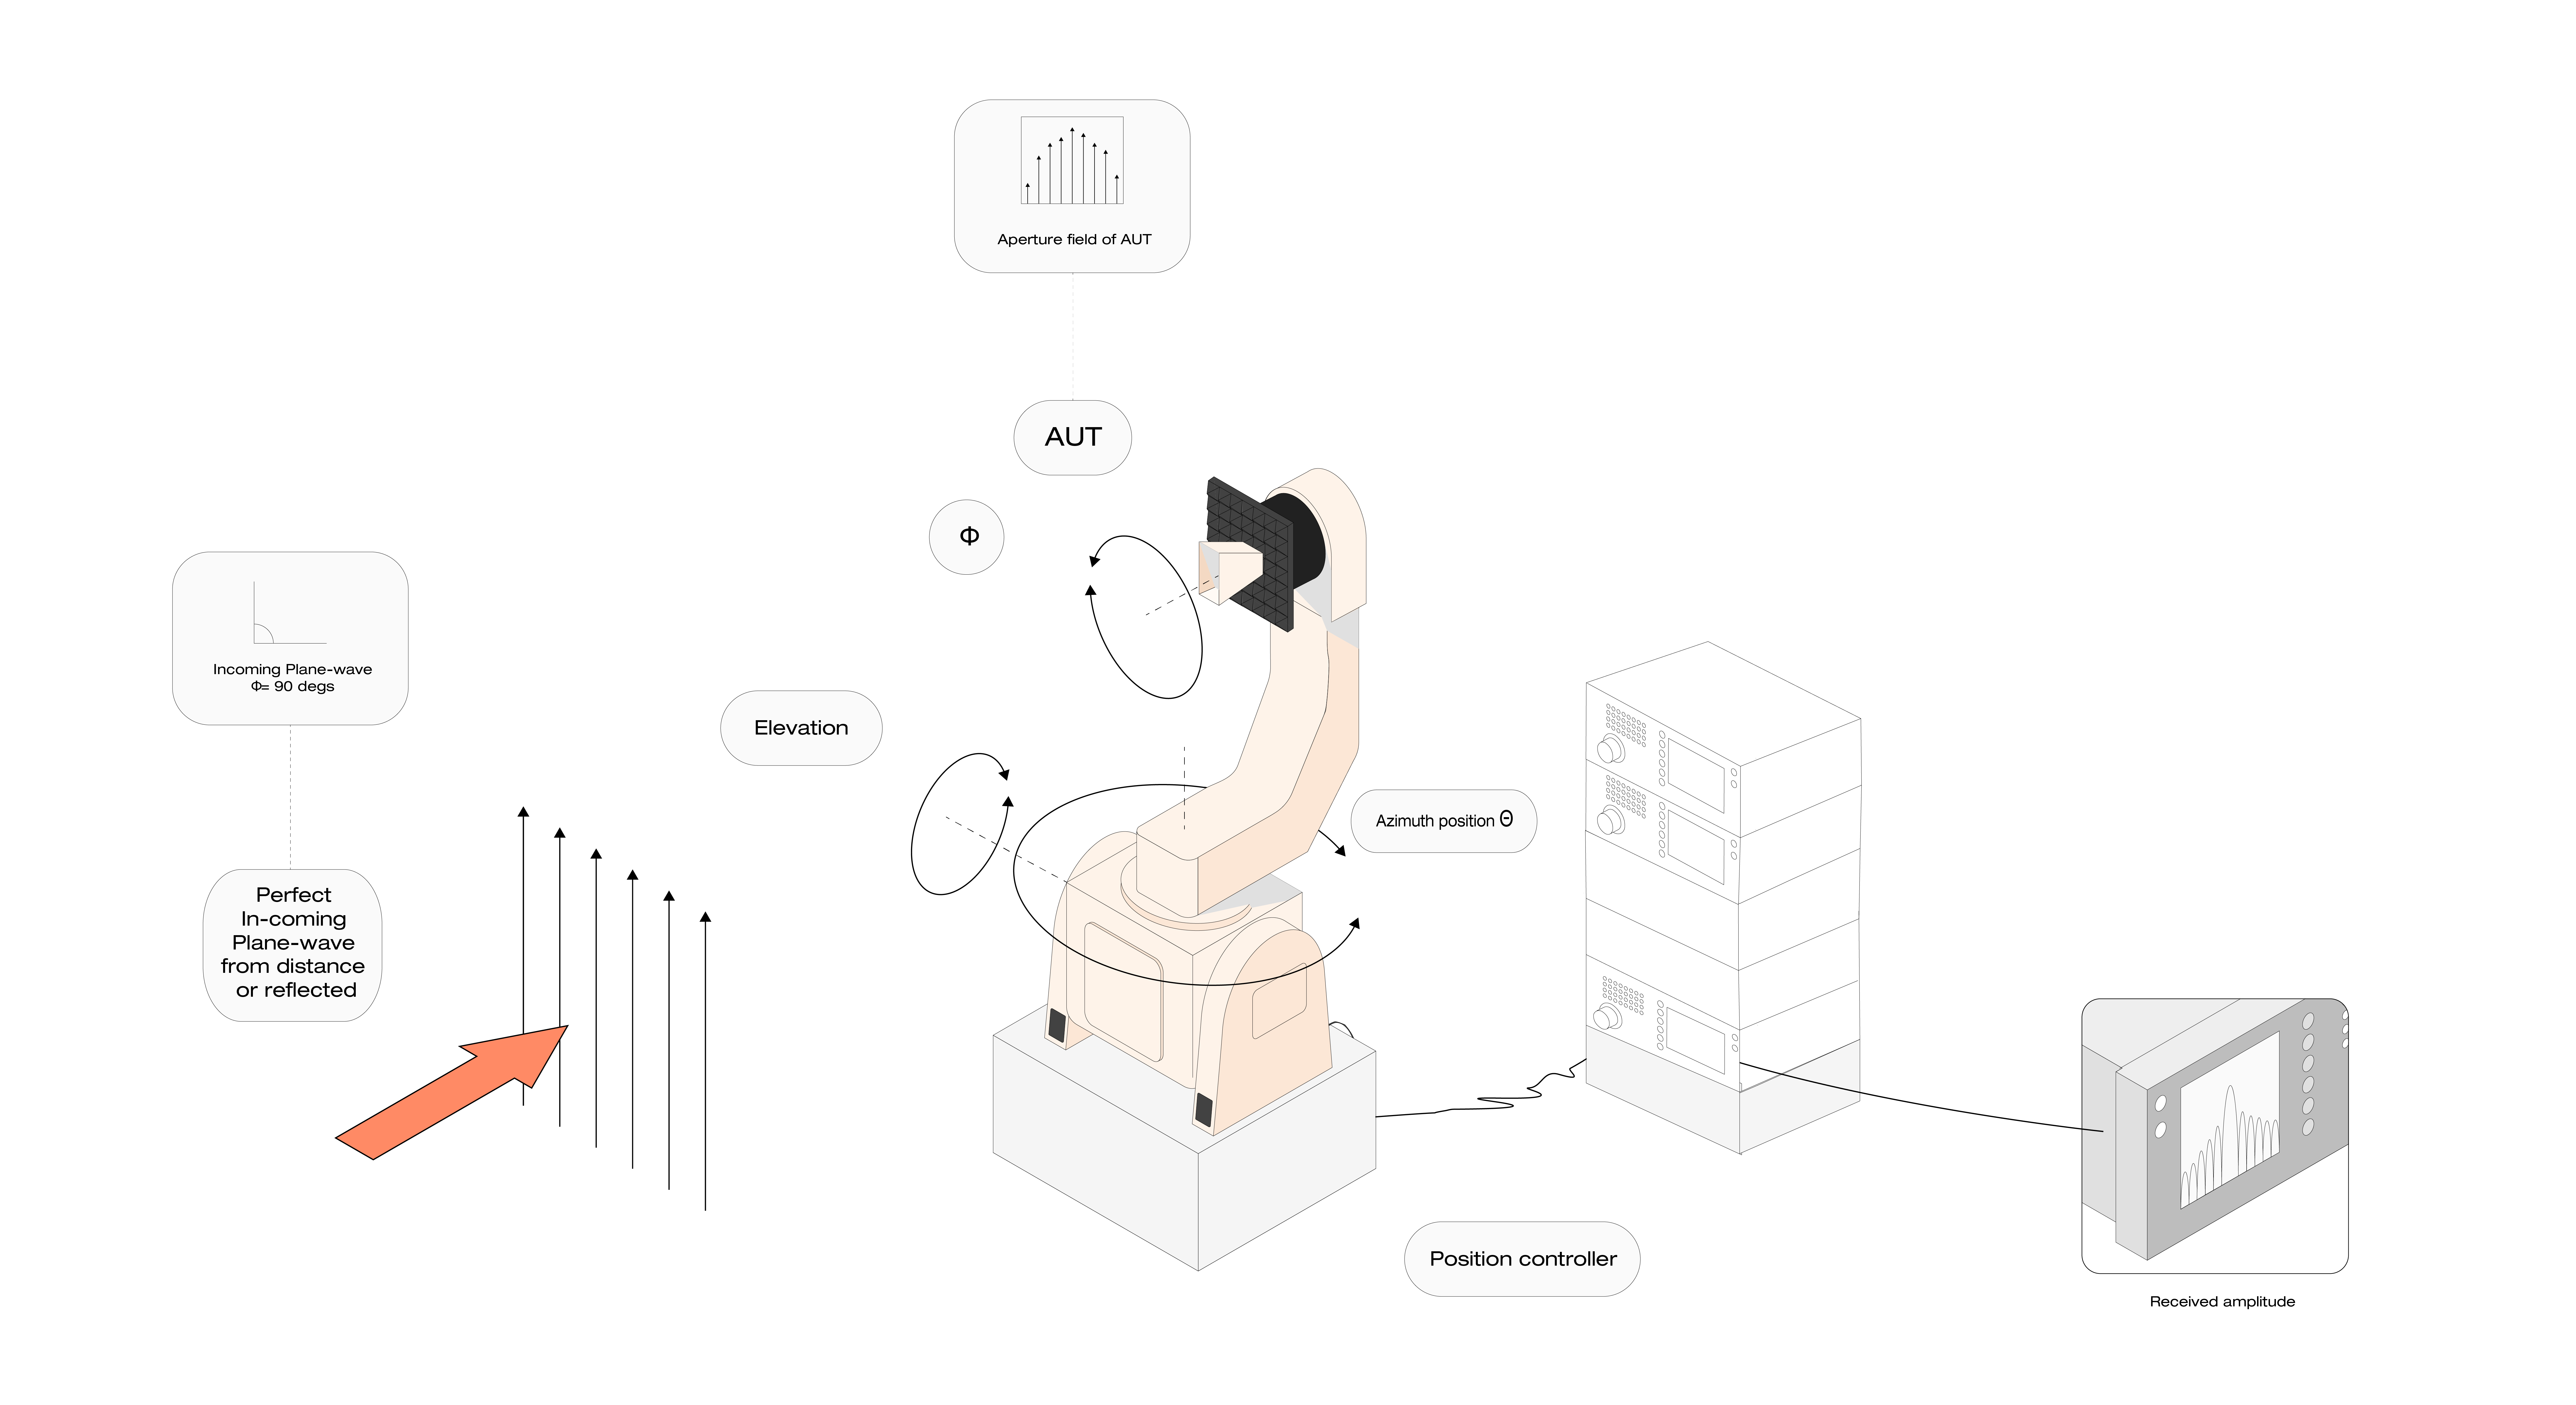
- Plots the directional selectivity (spatial filter characteristic)
- Relative strength of radiated field plotted as a function of angle
- Single positioner seldom used
- Typical need for two-dimensional pattern data
- Further axes needed for antenna alignment, e.g. lower elevation stage
- Example shown comprises:
-- Phi/Theta/Elevation positioner
-- Lower elevation axis used for AUT alignment
-- Upper Phi/Theta axes to take Spherical Near-field(SNF)/Far-field (FF) data
The radiation pattern of an antenna is a visual representation of its directional selectivity and is represented by plotting the relative strength of the radiated field as a function of angle. While only one rotation axis is required to generate a simple one‐dimensional plot, a single axis positioner is seldom used. By adding a second rotation axis, we can acquire 2D data for a complete spherical representation of the radiation pattern. Additional axes are typically added to further aid in the alignment of the antenna with respect to the source antenna.
Spherical Coordinate Systems for Antennas
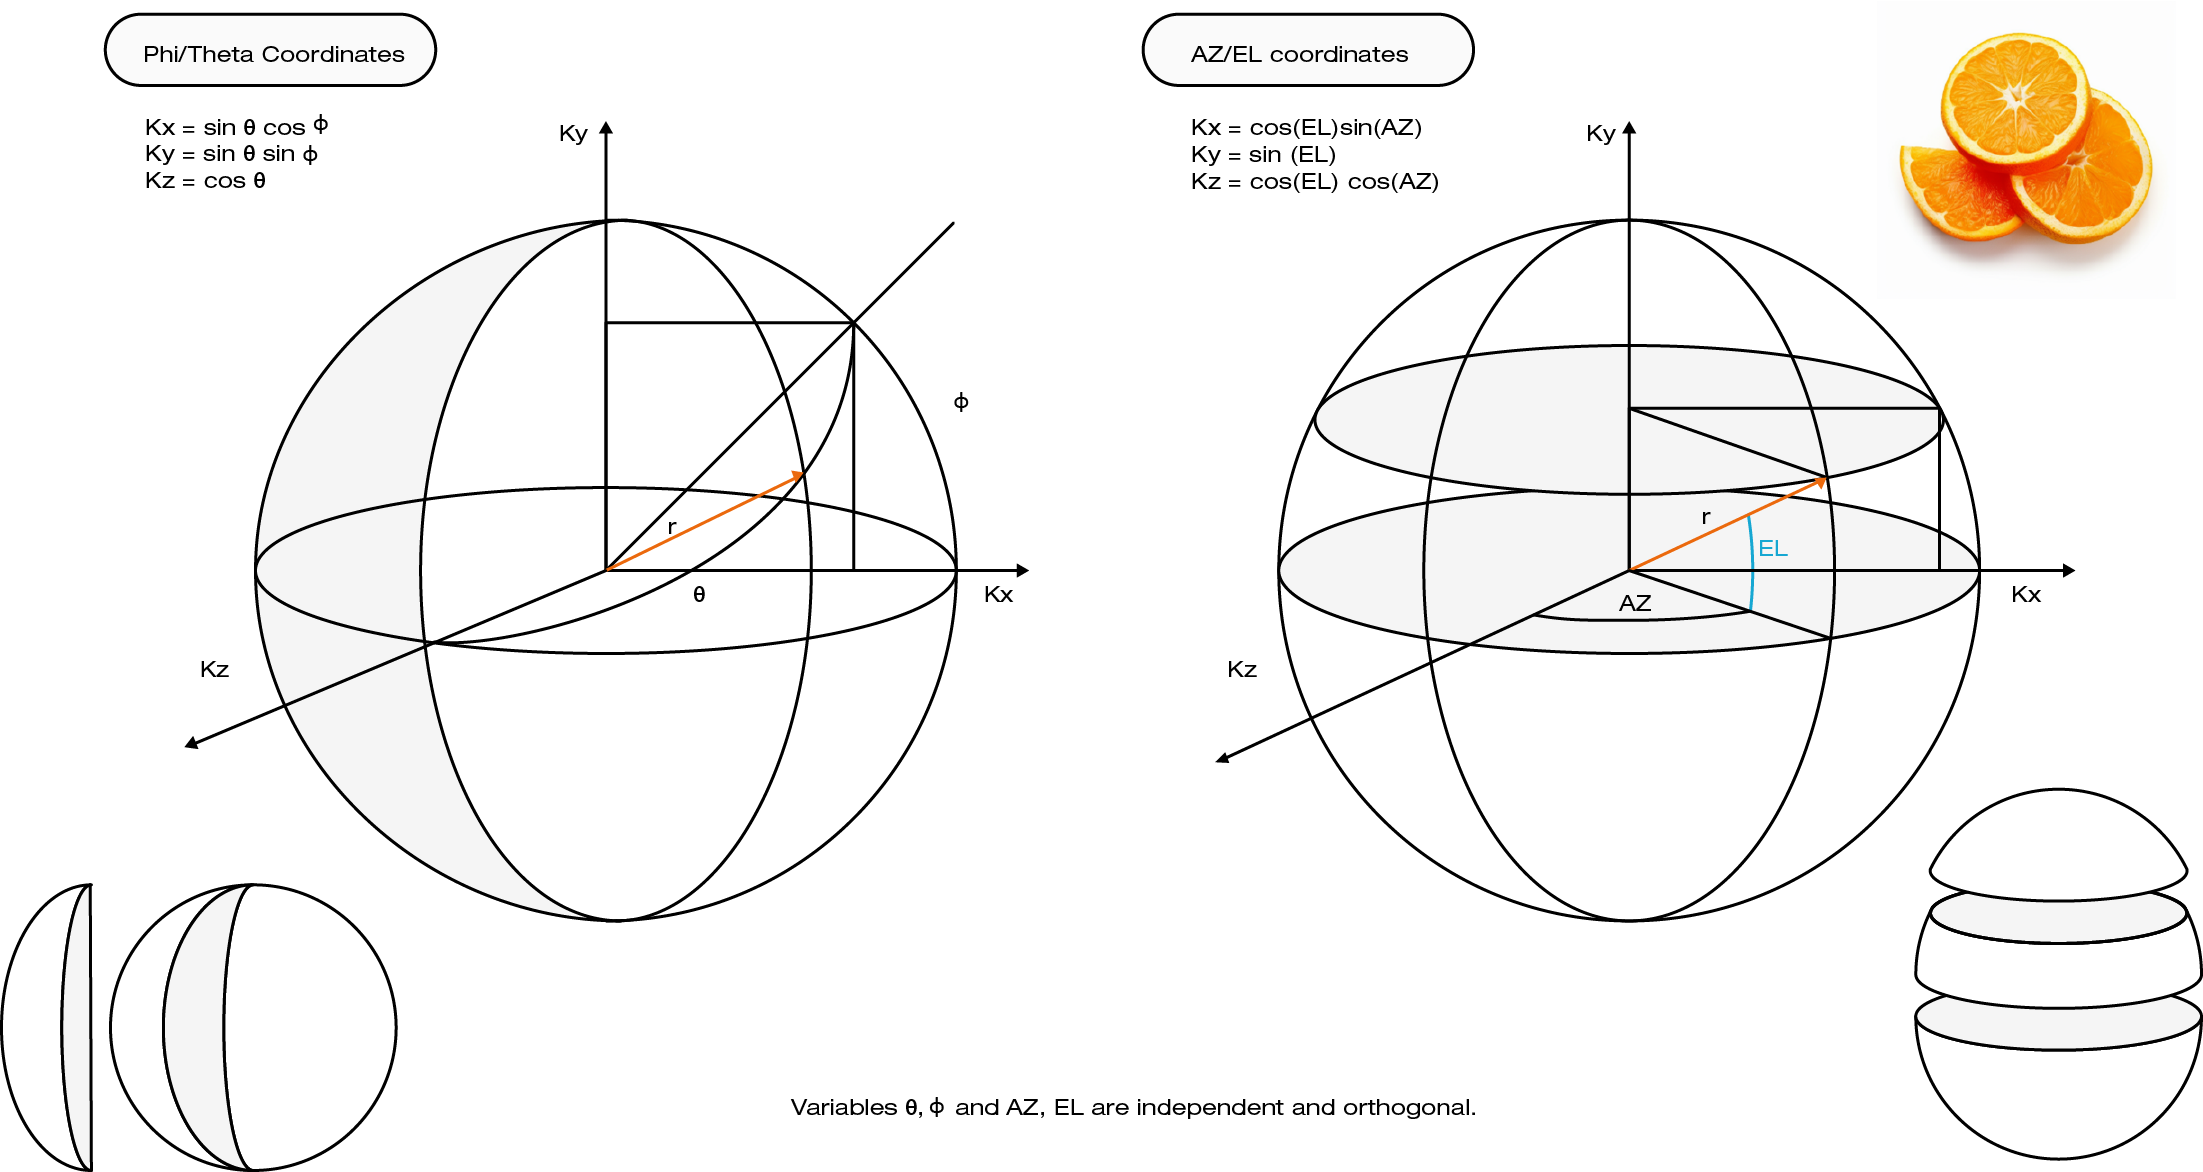
Different types of positioning systems can be used to acquire data in different coordinate systems. For example, a phi‐over‐theta positioning system supports data to be taken in either the phi or theta plane. An azimuth‐over‐elevation positioning system is used to acquire data in elevation planes (or elevation conical cuts). The coordinate system is typically dictated by the application in which the antenna is intended. For avionic application, the AZ/EL coordinate system is often preferred as this is typically used for aircraft coordinates.
So, which is the correct coordinate system to use? All depends on how you like your orange sliced!
The Near-field Measurement Concept
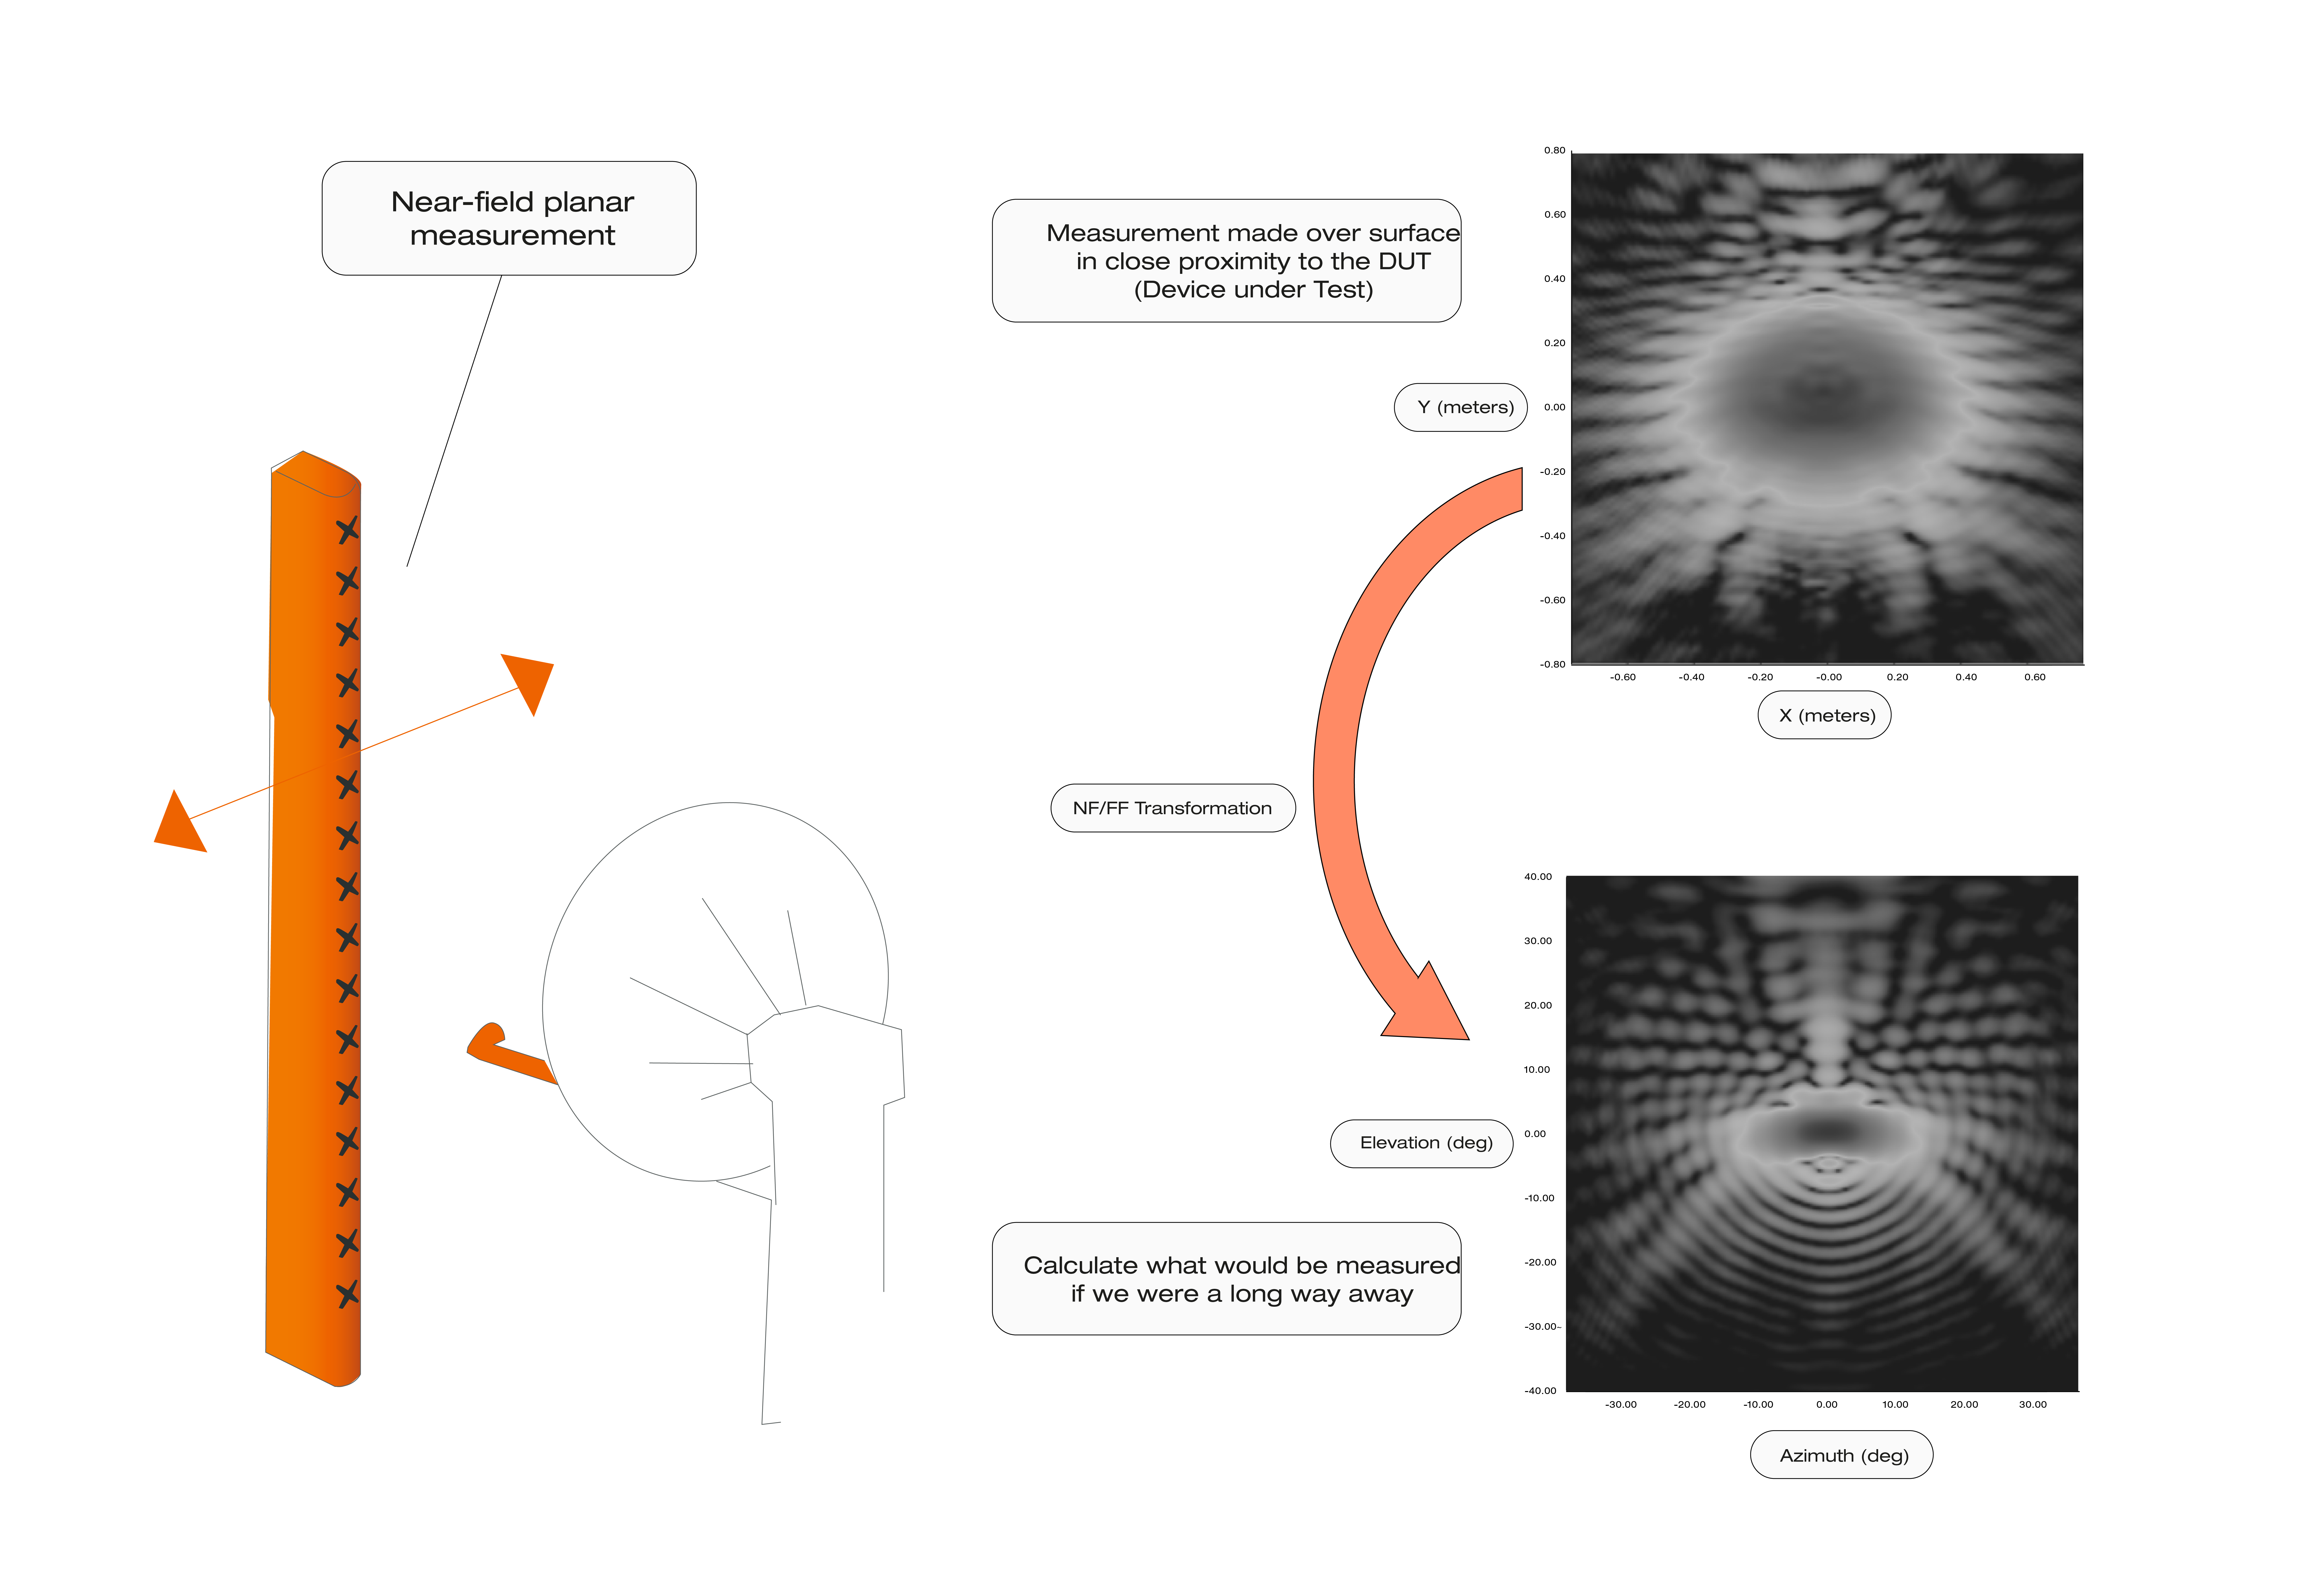
- Record amplitude and phase over a surface in radiating near-field (~3λ)
- Process with a mathematical transform to produce far-field data
Near-field measurement systems offer an alternative solution for characterizing antennas at reduced distances. In this case, the distance between the source (or probe) antenna and AUT is only several wavelengths. The near-field measurement concept requires collecting the energy in the radiated near-field of the antenna and then using a mathematical algorithm to spatially transform the results to the far‐field. Because this algorithm requires complex data (i.e. I/Q), measurements must include both amplitude and phase information. In addition, a significant amount of the radiated energy needs to be collected to provide accurate results, which requires 2D measurements. While the data processing takes only a few minutes to perform, the near-field measurement time may be significant. However, the end result provides 2D far-field pattern information in a much more time efficient manner than making the equivalent measurement using a far‐field system.
Topic overview

